Thank you for subscribing!
In the world of ecommerce, you may find yourself bombarded by data. Marketing, sales, product list management, and customer support software measure every aspect of your online business. They also produce more metrics than you can track, process, and analyze.
Any page view, click, and reaction on your website impacts your business’s overall success. User interactions (reflected in numbers) can give you insights into what you should start, continue, or stop doing to catalyze growth.
Now with all this data at hand, what should you focus on?
We reached out to SEO and marketing professionals, asking them which 5 ecommerce metrics they track regularly. Their lists included bottom-of-the-funnel metrics such as revenue and ecommerce conversion rate. All three experts mentioned average order value (AOV), while customer acquisition cost (CAQ) and Shopping cart abandonment rate (SCAR) each received two votes.

I would like to recommend the following metrics to be tracked channel, category, and product-wise on monthly, quarterly, 6-monthly, and yearly: Revenue, Goal conversion ratio, Average order value (AOV), Customer Acquisition Cost (CAC), New vs returning customers.
Click to share

The 5 main ecommerce metrics I advise tracking are sales conversion rate, customer lifetime value, average order value, customer acquisition cost, and shopping cart abandonment rate.

The five ecommerce metrics you should track are revenue, profit, conversion rate, average order value, and abandoned cart rate. All of these metrics when combined help show you the health of your business and indicate how you can improve your overall sales. High revenue and low profit indicates that you might run out of money to continue your business long term, so analyzing your average order value and trying to boost it can help you raise your profits.
These quotes prove that there is no one-size-fits-all solution when it comes to e-commerce metrics. You’ll need to choose your own set that will fit your project best.
In this article, we’ll go through a list of popular ecommerce metrics to track. Any of them work as key performance indicators (KPIs) and inform you about how to spur your business’s growth.
These are the metrics we’re going to cover (jump to each section if you’re looking for particular ones):
Let’s start by determining what ecommerce metrics are and their types.
What is an ecommerce metric?
Anything you can measure regarding the performance of your online store is a metric. It can be the number of clicks a particular page gets from Google’s search results, the conversion rates of a particular campaign, or your net revenue per month.
Types of ecommerce performance metrics
Every customer begins their journey through your ecommerce funnel from one of these four stages: acquisition, engagement, conversion, and retention. Each stage of the funnel has its own set of metrics. You can also divide metrics by a specific marketing channel and have SEO metrics to track, along with website conversions, email metrics, and so on.
When measuring your business’s success, your metrics can be categorized as either lagging or leading.
- Lagging metrics measure the results. They are indicative of the past and describe what has been done. For example, revenue is a high-level lagging metric that shows the outcome of your business’s activities as a whole. Lagging metrics are good for evaluating where you currently stand. At the same time, they don’t give you any hints about what has impacted your results and how you can perform better in the future.
- Leading metrics precipitate the results. They measure the activities, processes, or behaviors that happen one or two steps before the result is achieved. For example, the add-to-cart rate and cart abandonment rate are leading metrics influencing your site’s overall conversion rate. Leading metrics point to the things you should fix or change to improve your outcomes. It means they are actionable.
You’ll need to track both lagging and leading metrics, but if you consider all aspects of your business, you’ll see that you have hundreds of parameters to track. Tracking everything is not a viable option, so you should prioritize some metrics over others. Define the metrics that better reflect your goals at the current stage of your business’s life cycle and set your ecommerce KPIs based on them.
Metrics vs. KPIs
To gauge your performance relative to your main business goals, set a bunch of KPIs for your key metrics. You’ll have 3 to 7 of them at a time. You’ll likely change them or substitute some of them as you achieve your goals or come across new business challenges and growth opportunities.
What exactly are KPIs? In a nutshell, KPIs are the target values for your most important metrics. They reflect the metric’s required performance level for reaching a particular business goal. To see if you’re on track, compare your current measurements at any given time against your pre-defined KPIs.
Setting KPIs for an online store
There’s no one-size-fits-all approach to setting ecommerce KPIs because the main rule for KPIs is that they should be relevant to your current goals. KPIs differ because goals change all the time, but the process of setting them is the same for all. It includes the following steps:
- Decide on the goal you want to achieve. If you’re launching a new store, focus your efforts on establishing your online presence and growing traffic. If your online business is mature, consider improving your site’s conversion rate or customer retention rate.
- Choose 3 to 7 metrics supporting your goal. This is only a suggested range. You can decide how many parameters to measure and analyze. Since there are so many indicators, focus on the ones that have the greatest capacity to help you reach your goal.
- Set SMART KPIs. SMART stands for Specific, Measurable, Achievable, Relevant and Time-Bound. To define an achievable target value for each metric, check ecommerce benchmarks, consider the resources you have, and estimate your potential impact on the metrics.
- Configure and test ecommerce analytics tools. Make sure you have reliable tools that capture all the necessary data and measure the chosen metrics accurately.
- Monitor your KPIs and put them to action. Pit your metrics up against KPIs on a regular basis. If some metrics aren’t performing at 100% of your KPI, review and adjust your activities to catch up.
When setting KPIs, online store owners often choose one of the following metrics. Look through the list below to find out which metrics you should be tracking.
Ecommerce metrics to use as KPIs
Setting KPIs for some of the following metrics can positively impact your business’s growth, but you have to measure them accurately and have a well-thought-out performance improvement plan.
We’ve divided the most important e-commerce indicators into 4 categories: acquisition, conversion, transaction, and retention.
1. Customer acquisition metrics
The acquisition metrics help you track and evaluate how many visitors your online shop gets, what channels they come from, and whether your marketing efforts pay off.
The number of visitors
This metric lets you know how many people come to your site. The number of visitors should be measured overall and by channel.
Google Analytics will help you measure the number of visitors coming from organic search, paid ads, email, socials, or referring sites. By comparing these channels, you’ll see which of them work well, which require improvements, and which may not be worth the effort.
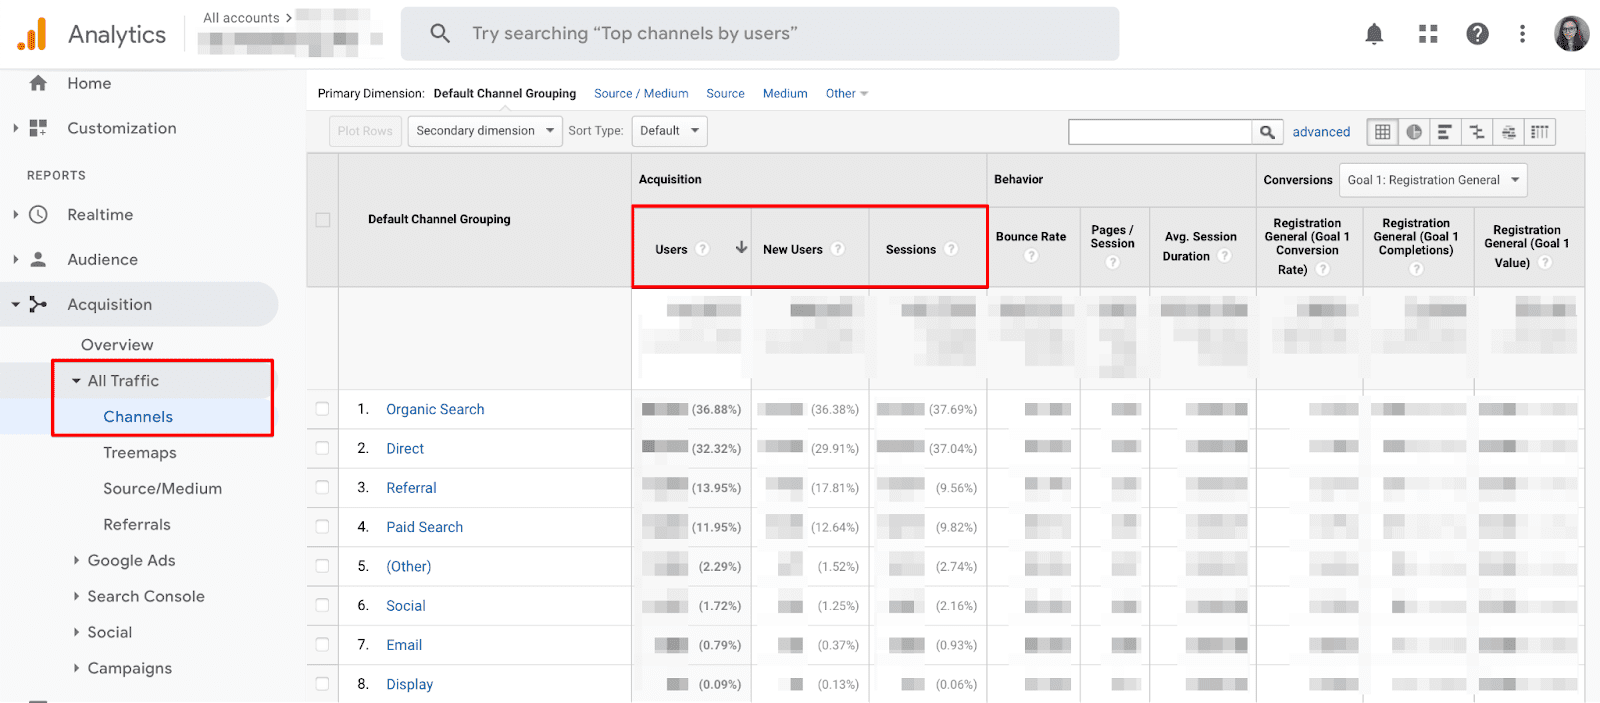
It also makes sense to track the number of new visitors to see how fast your audience grows:
(#) New visitors = (#) Overall visitors – (#) Returning visitors
Customer acquisition cost (CAC)
This metric shows the marketing and sales expenses required to attract a visitor and convert them into a customer. You can include in the calculation the money spent on marketing campaigns, subscriptions for software tools, and team salary.
($) CAC = ($) Sales and Marketing Expenses / (#) New Customers Acquired
Knowing your CAC will help you estimate your business’s sustainability. To figure out if your CAC is healthy, compare it to other metrics, such as average order value and customer lifetime value (we’ll cover them later). Having a CAC of $20 and an AOV of $15, for example, means that you’re losing money on the first sale. But this isn’t a bad thing if every customer stays with you for half a year and makes repeat $15 purchases weekly.
Cost per Acquisition (CPA)
Unlike CAC, CPA is a more granular metric measured for paid customer acquisition channels or specific marketing campaigns. It’s typically measured for Facebook and Google Ads because these campaign types have the clearest correlation between costs and outcomes.
($) Cost Per Acquisition = ($) Customer Acquisition Channel Spend / (#) Customers Acquired Through the Same Channel
Consider the CPA relative to the overall CAC. If the CPA for a particular channel is high, try to optimize it even further to boost your business’s growth and profits. If the CPA is low, consider changing the strategy or raising the budget to reign in more customers and speed up growth. For example, higher bids in Google Ads can help your ads win more impressions and gain more leads.
ROMI and ROI by channel
Return on Marketing Investment (ROMI) measures the overall effectiveness of marketing activities and reflects how investments in marketing impact the revenue.
(%) ROMI = (($) Revenue Attributed to Marketing – ($) Cost of Goods Sold – ($) Marketing Spend)) / ($) Marketing Spend) * 1000
When your ROMI equals 100%, the outcome of your marketing activities covers the costs but doesn’t increase your revenue.
Track return on investments for every customer acquisition channel separately to figure out a better way of distributing resources between them. You can also separately track these ROIs to distinguish between profit-making and loss-making marketing activities.
(%) ROI by Channel = (($) Revenue Attributed to the Channel – ($) Cost of Goods Sold – ($) Spend on the Channel)) / ($) Spend on the Channel) * 100
ROI by channel is often a tricky metric to calculate. This is because there are difficulties associated with attributing results to particular channels. Since most customers have multiple touchpoints on their path to purchase, you must choose between first-touch, last-touch, and weighted multi-touch attribution models.
2. Conversion metrics
These metrics are control points at all steps of the customer journey. They help you see if there are any problems stopping site visitors from becoming customers. A common pain point for ecommerce sites is losing leads at the very bottom of the funnel. This is why the following three metrics are very important to track for any online store.
Visit-to-purchase conversion
This metric refers to the percentage of website visitors making purchases and shows the overall efficiency of the marketing and sales funnel.
(%) CR = ( (#) Total Customers / (#) Total Unique Visitors) * 100
A low overall conversion rate indicates that something is wrong with your funnel. It can attract the wrong audiences, provide a bad experience at the checkout, or anything in between. It’s difficult to improve conversion rate without measuring more granular metrics.
A single misfired campaign, a malfunctioning website page, or an unpopular product can dilute the aggregate conversion rate. To find ways to optimize your conversion rate, you should separately measure conversion:
- By channel, to know if SEO, email, PPC ads, or socials drive qualified traffic. Adjust your activities in these channels to improve their efficiency.
- By product category, to see what products sell well and to optimize your inventory to meet customer demands.
- By marketing campaign, to know what messages and offers resonate with your audience and to know which marketing activities to stop or scale.
- By customer journey step, to find and fix your site’s content and design problems, especially ones that spoil customer experience and make people exit halfway through their journey.
Knowing your conversion rates by marketing channel, product, or customer journey touchpoints will help you choose the most effective ways of attracting customers, stock up on more products that sell well, and fix your website’s user experience issues.
Add-to-cart rate
This metric shows the share of user sessions in which users added at least one item to the shopping cart after viewing the product page.
(%) Add-to-Cart Rate = ((#) Sessions with Clicks on Add to Cart / (#) Total Sessions) * 100
Add-to-cart rates provide insights into your product selection, presentation, and pricing. These rates can be low if you sell products lacking in demand or your product description pages disappoint visitors. Even if your products are presented well and are fairly priced, issues with site structure and navigation, search, and overall usability can still harm this metric.
Shopping cart abandonment rate (SCAR)
This metric shows how many online shoppers add items to their cart on your website but don’t complete the purchase.
(%) SCAR = (1 – ((#) Completed Purchases / (#) Carts Created)) * 100
By tracking the percentage of engaged people who leave at the final step before buying your products, you can spot some potential problems at the checkout process. These include:
- Technical flaws damaging user experience.
- Limited or insecure payment options.
- High shipping costs or unexpected additional charges.
- Unclear return and refund policies.
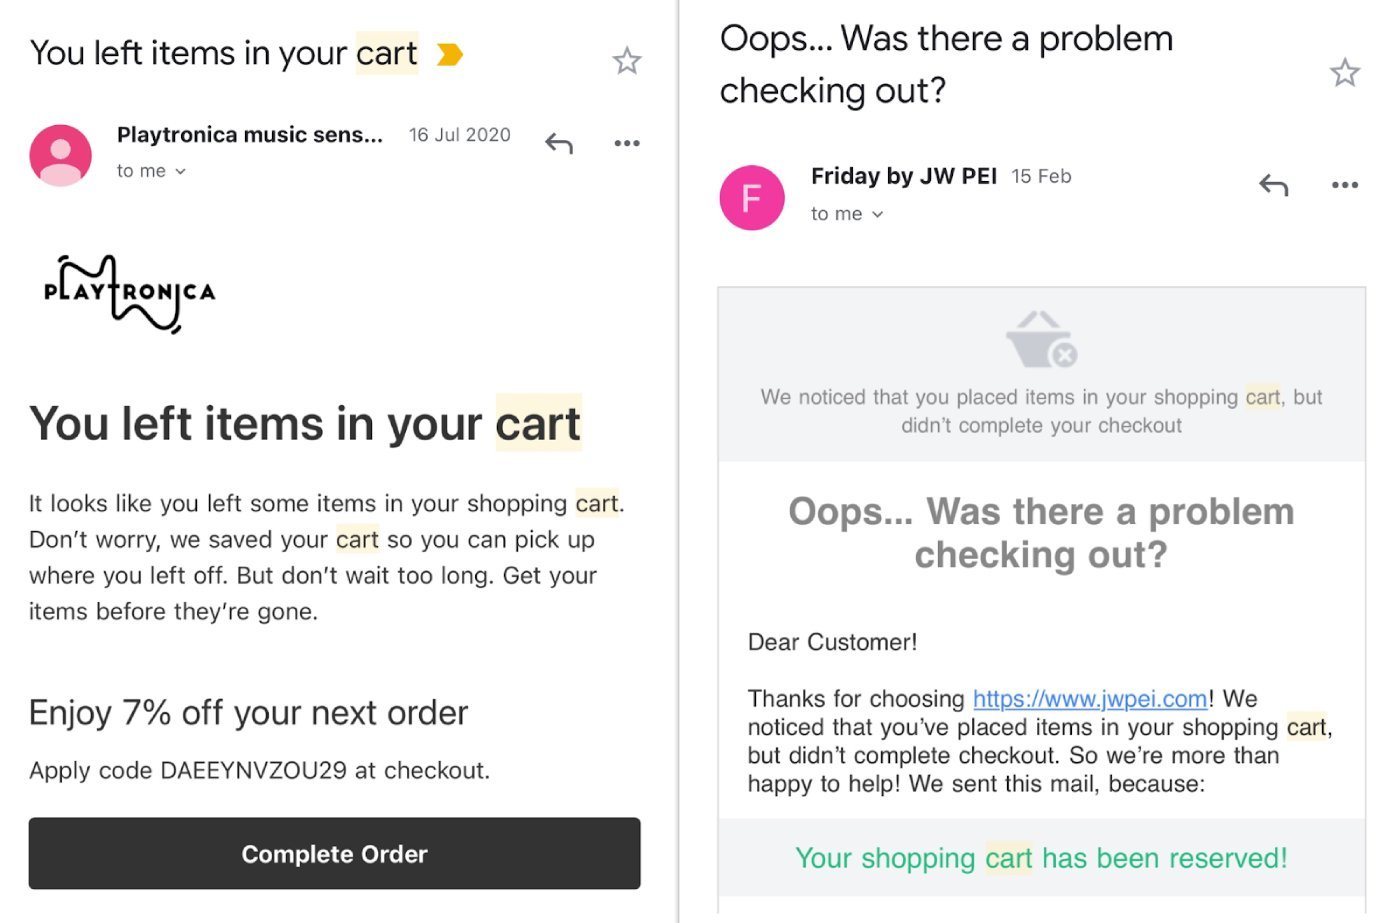
Apart from fine-tuning the checkout process, use retargeting and cart recovery emails to nudge cart abandoners to finish the purchase. Even if you optimized your website’s conversion metrics perfectly, people will still abandon carts if something distracts them during the checkout process.
3. Transaction metrics
Conversion into a purchase is a substantial metric in its own right, but your sales are what really make you money. To optimize for transactions, figure out how many products you sell, how many returns come in, and how much revenue you generate.
Units per transaction (UPT)
This metric refers to the average number of items sold for each purchase that a customer makes.
(#) Units per Transaction = (#) Items Purchased / (#) transactions
UPT helps you understand buying patterns so you can tell if your promotional campaigns are working. For example, let’s say you want to empty your stocks during a sale. You expect your UPT to be higher than average. If customers buy lots of items from your store, it means you have a good grip on their tastes and preferences. The more your brand (or product selection and pricing) resonates with consumers, the more sustainable your business will be.
To raise the number of products sold per order, include product recommendations in carts to cross-sell complementary items. For example, it would make sense to offer socks to people buying sports shoes. You can also try to sell products together as a bundle.
Average order value (AOV)
This metric shows the average amount of money your customers pay per order calculated over a period of time by the following formula:
($) Average Order Value = ($) Total Revenue / (#) Orders Placed
Measuring AOV can help you understand purchasing patterns in your store. For example, a low AOV can indicate that people mostly make one-item orders or tend to buy cheap items. Beware of including irregular (extremely high-value or low-value) orders in the AOV calculation. These orders spoil the metric.
Improving AOV is often a fast way to increase revenue. To nudge your customers to spend more, consider offering free shipping to orders with a 30% higher value than the current AOV, or create product bundles. Also, implement product suggestions on product description pages to upsell customers who are open to considering higher-priced alternatives.
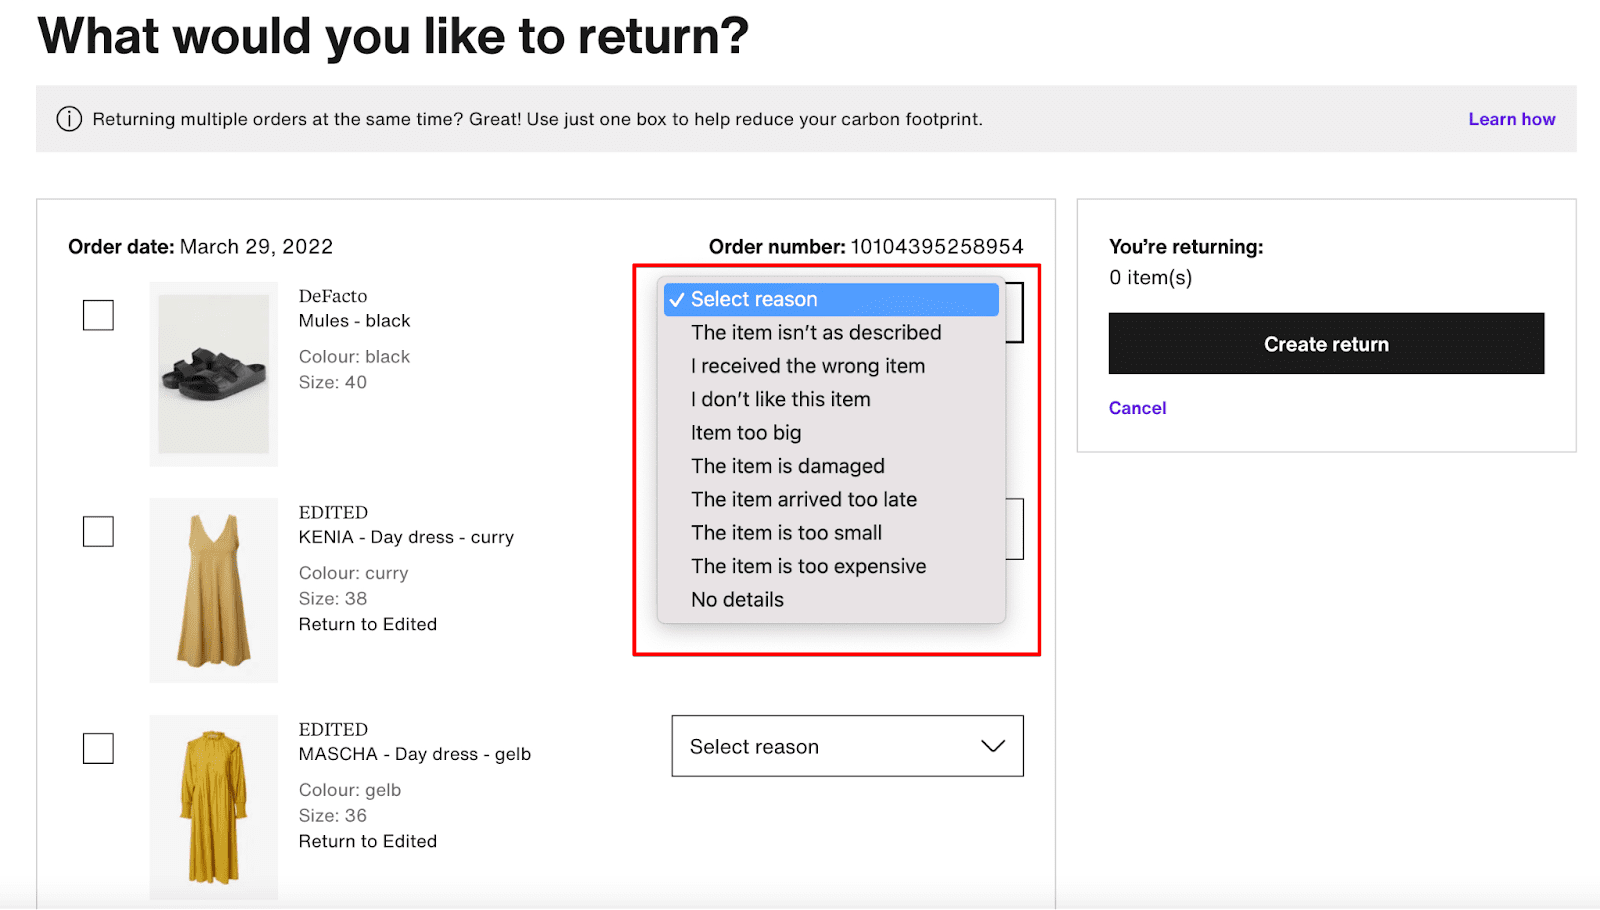
Product return rate
This metric represents the percentage of returned products over the total number of products sold. Alternatively, it can be calculated in the money equivalent below.
(%) Return Rate = ((#) Returned Items / (#) Sold items) * 100
High return rates mean lost sales, unhappy customers, additional return costs (shipping, refurbishment, repackaging, restocking, etc.) that drain your profit.
When calculating the return rate, decide whether to count refunds only or include product exchanges, too. As for the exchange transactions, distinguish between positive, negative, and neutral ones. These all impact the bottom line differently.
Don’t forget that returns are an additional customer touchpoint. You still have an opportunity to retain sales by offering customers to replace an item, or at least collect feedback and address the problem that caused the return.
4. Customer retention metrics
Getting a new customer can cost five times as much as retaining an existing customer. This is why at some point of your business lifecycle, you’ll need to shift your attention to retention metrics and set KPIs for them.
Repeat customer rate (RCR)
This is the proportion of customers that have purchased from your store more than once. This number shows you how much value your store brings to customers and how your customer retention activities operate.
(%) RCR = ((#) Return Customers / (#) Total Customers) * 100
When considering your RCR, keep an eye on other metrics. For example, if you attract a lot of new customers, your repeat customer rate will decrease naturally, but that isn’t necessarily a bad thing.
Setting a KPI for RCR is natural if you sell consumable and expendable products, like food or cosmetics. If you sell items that people don’t usually purchase multiple times, like home furniture, for example, this metric won’t be that valuable.
To track RCR metric, you can make use of the UA reporting template for Universal Google Analytics that was put together by Himani Kankaria and the Missive Digital team. You may also find useful Himani’s presentation on Remarketing from her BrightonSEO talk.
We’ll discuss ecommerce reporting Google Analytics offers in greater details in the next sections.
Customer lifetime value (CLV)
This metric is the dollar value of a customer-business relationship. It shows the total revenue a business can expect to get from a customer from the beginning to the end of the relationship. It can be calculated using different formulas. This one works for online retailers:
($) CLV = ($) Average Order Value * (#) Transactions per Customer * (# years) Average Retention Time * ($) gross margin
By calculating CLV, you can find the upper limit of your customer acquisition and retention spend. In other words, your CLV is the money you should be willing to spend to get a customer and to avoid losing them.
By comparing your CLV to CAC, you might find out that you’re missing opportunities from not spending enough on acquiring customers. If you calculate the CLV by customer segment, you’ll know what types of customers to spend on.
Net Promoter Score
This metric shows how likely customers are to recommend your store to someone else. It gauges your customers’ willingness to promote your business on a 0 to 10 scale and classifies them into three categories: promoters (9–10), passives (7–8), or detractors (0–6).
NPS = ((#) Promoters — (#) Detractors) / ((#) Respondents) x 100
To measure NPS, send an online poll to your customers. It can be in the form of pop-up surveys on your Thank You pages, or included in follow-up emails or chat messages. Use the results to predict repeat purchases and word-of mouth-marketing-related business growth.
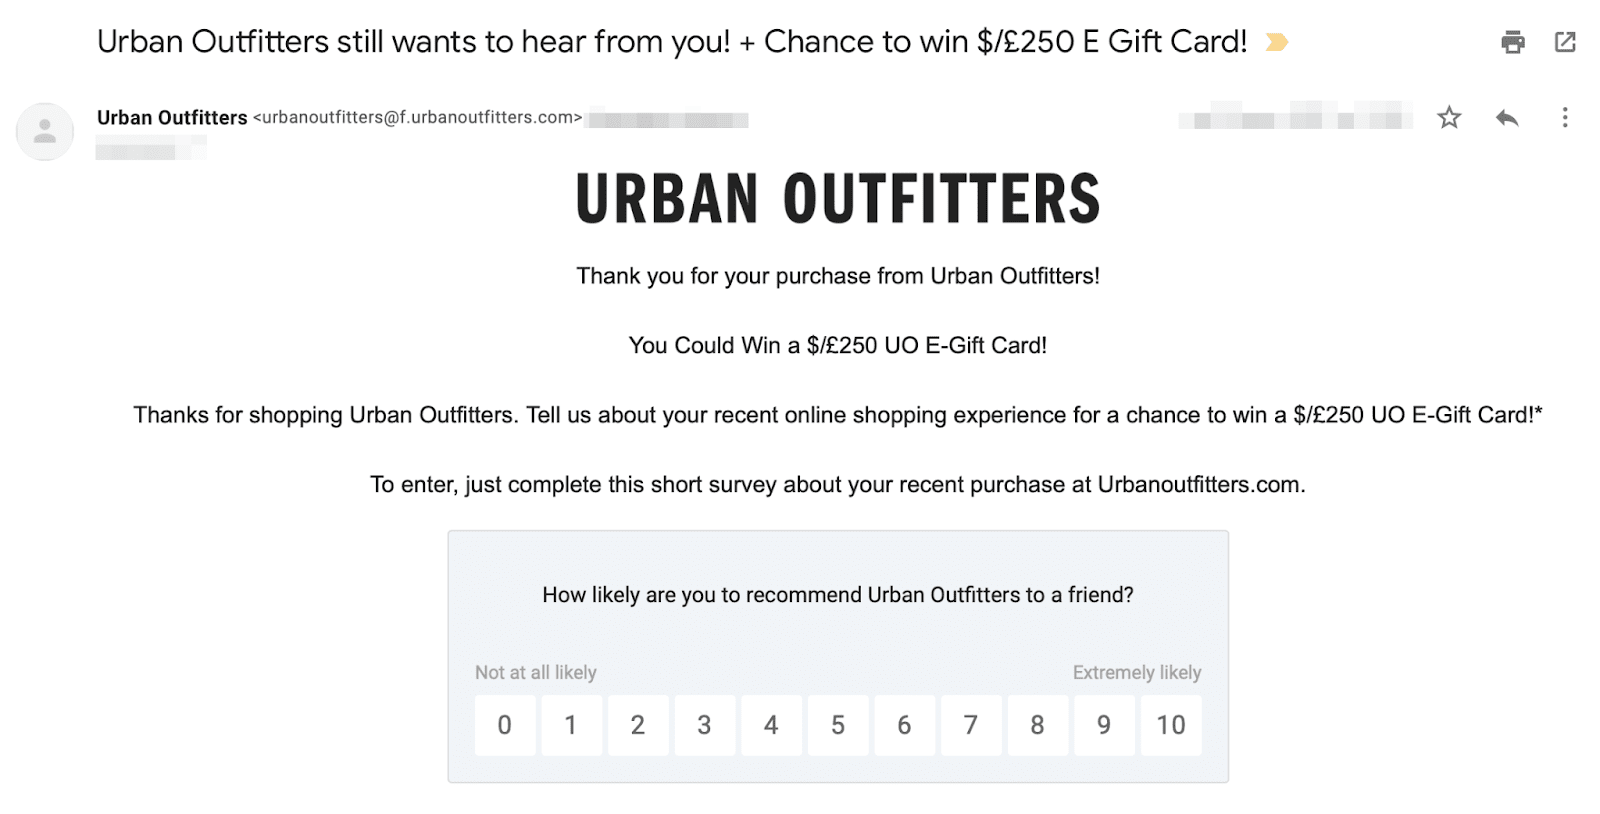
To get even more insights from these surveys, consider asking follow-up questions (diagnostic questions) to collect feedback. For example, you can discover how to improve upon promotional strategies that aren’t working as well as find out what is working.
Tracking ecommerce KPIs in Google Analytics
For an online store, it’s possible to track all of the mentioned metrics using a single tool. Just connect Google Analytics to your site. If you have a basic Google Analytics (GA) account, however, you’ll need to take a few extra steps to enable its Ecommerce or Enhanced Ecommerce features.
Set up ecommerce tracking in Google Analytics
To collect and analyze purchase and transaction data from your website in GA, enable Ecommerce reports. When turning this feature on, choose between standard Ecommerce reports or Enhanced Ecommerce reports. Go to Admin > Ecommerce Settings > Ecommerce set-up.
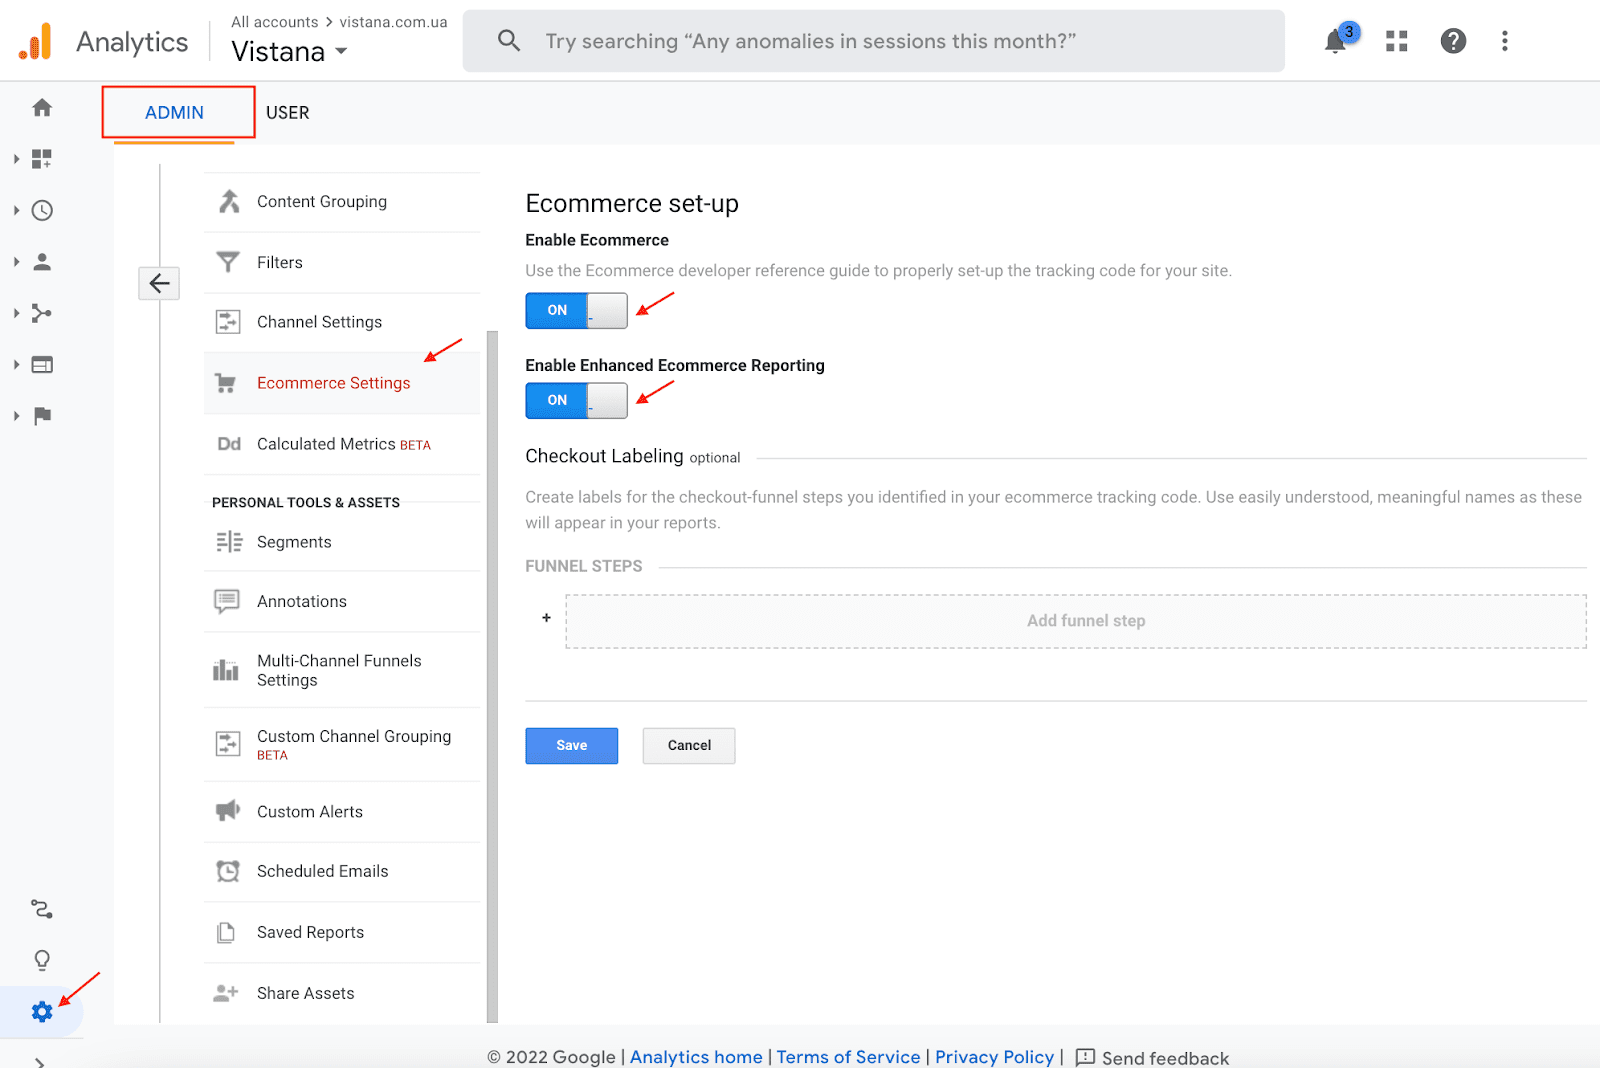
To let GA collect transaction and product-related data, add a special code snippet to your website. Either get assistance from a developer or follow the instructions provided by ecommerce platform vendors like WooCommerce, Shopify, BigCommerce, or others.
Ecommerce reports in Google Analytics
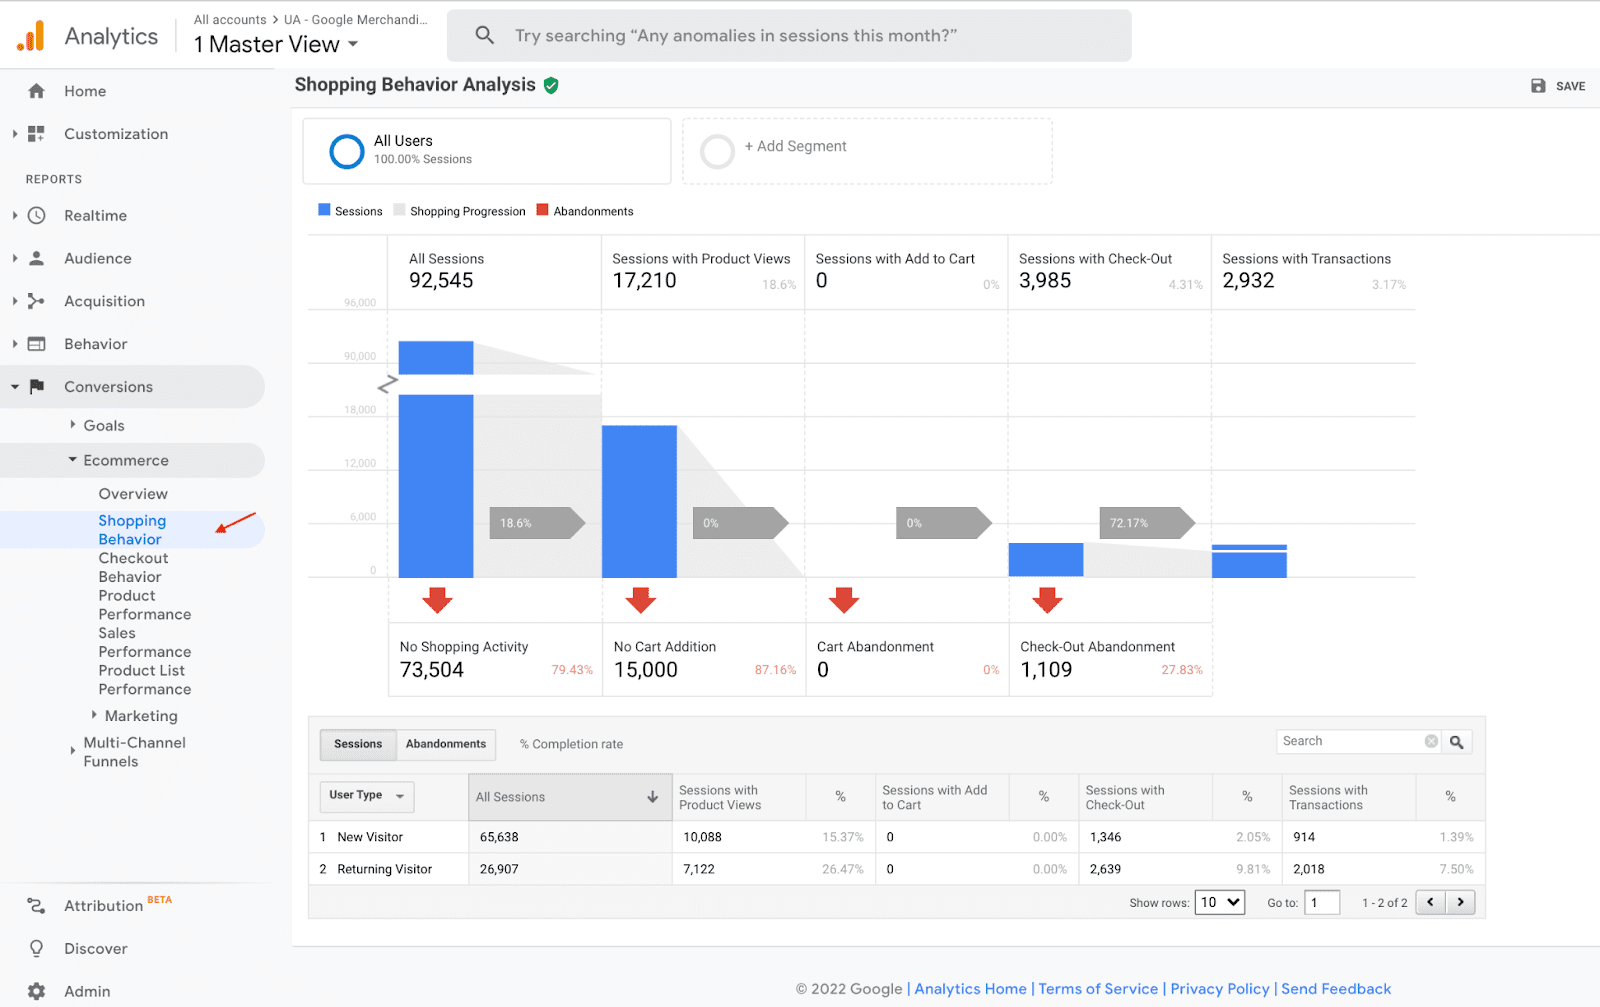
By checking out Google’s Merchandize Store test account, you can estimate the full power of the 10 reports that will become available after you activate Enhanced Ecommerce in GA. Access them under Conversions > Ecommerce. The Revenue, Conversion Rate, and AOV metrics are displayed directly in the Overview report.
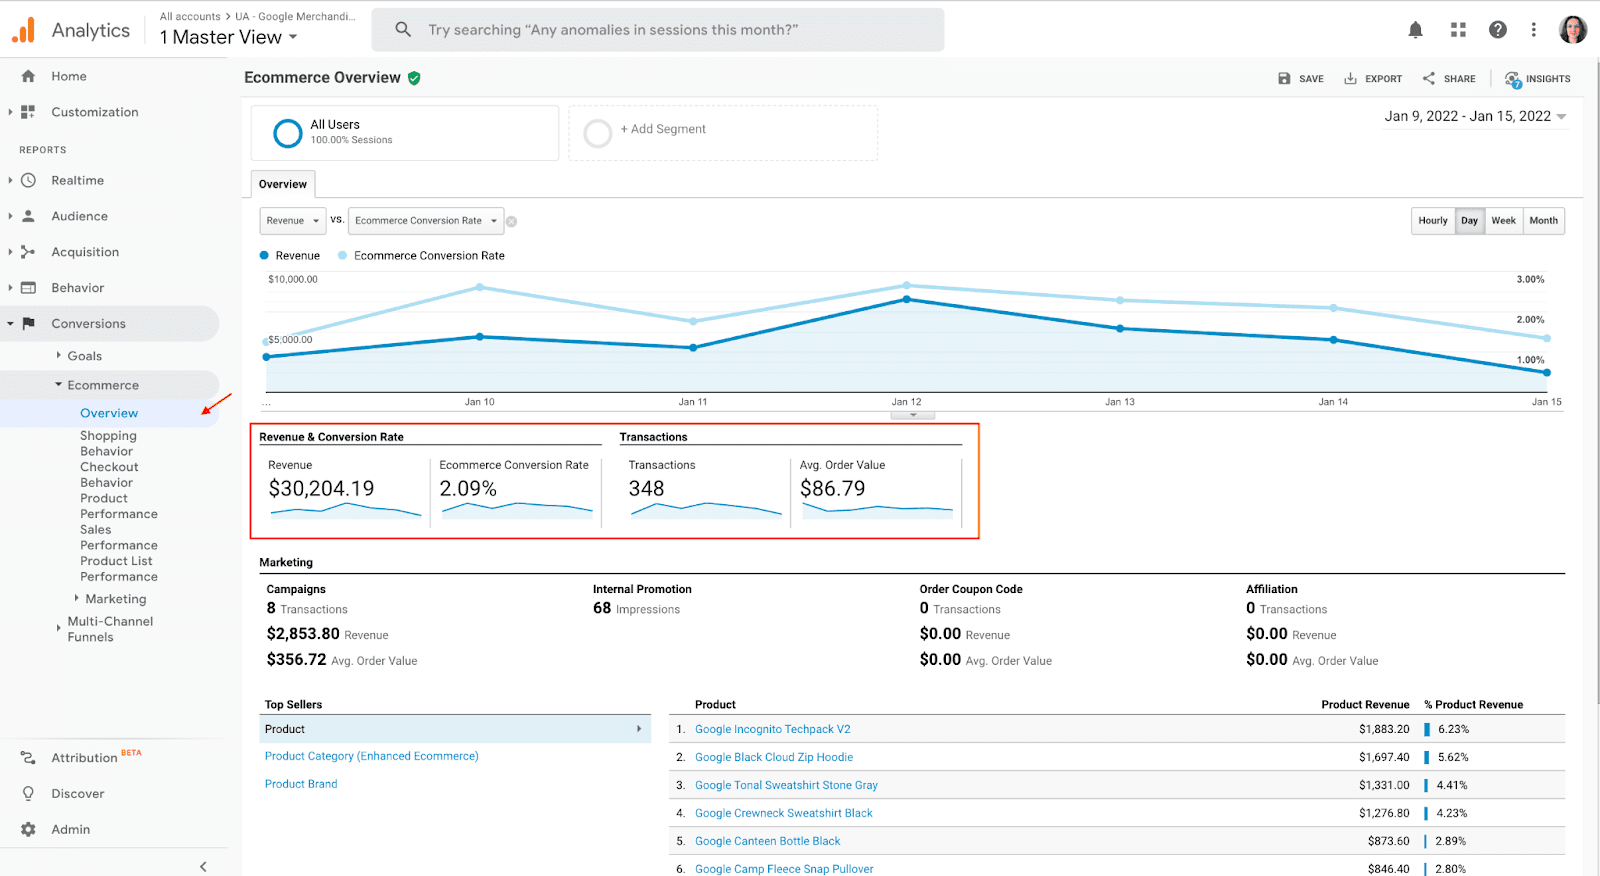
From the diagram of the Shopping Behavior report, you can get data on add-to-cart, cart abandonment, and checkout abandonment rates. See in the table below how you can compare purchases and on-site activities performed by new versus returning visitors:
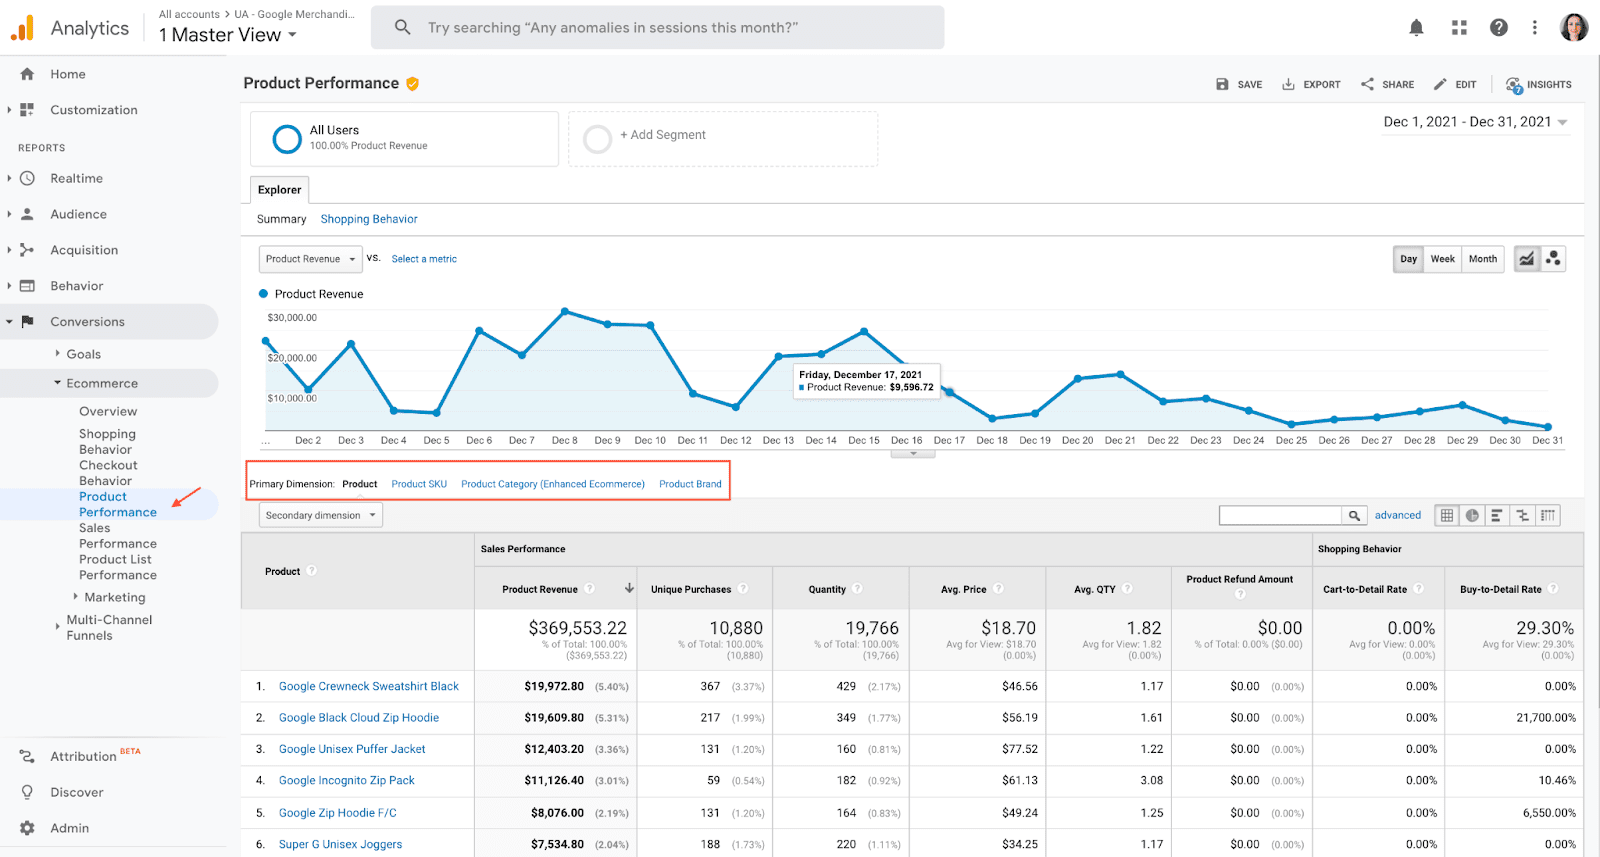
To get insights on how different list items sell as well as how much revenue they bring, look at the Product Performance report. Choose secondary dimensions to analyze data by product category or brand.
These and other reports from GA can cover your major ecommerce KPI tracking needs. Use it to correlate your sales data with other website usage data and attribute results to different marketing channels.
Closing thoughts
Online stores have much better access to marketing and sales data than brick-and-mortar stores. But to turn your data into power, know what metrics to focus on and pinpoint which KPIs have the greatest impact on your ecommerce success. Keep an eye on the chosen indicators and they will help you predict and improve future sales, revenue, and customer satisfaction.

